The Dashboard menu is available to only administrators and provides valuable insights into their school or district’s usage of Classroom. Admins can choose from a variety of widgets to track key usage stats and better understand how Classroom is being used by teachers and students.
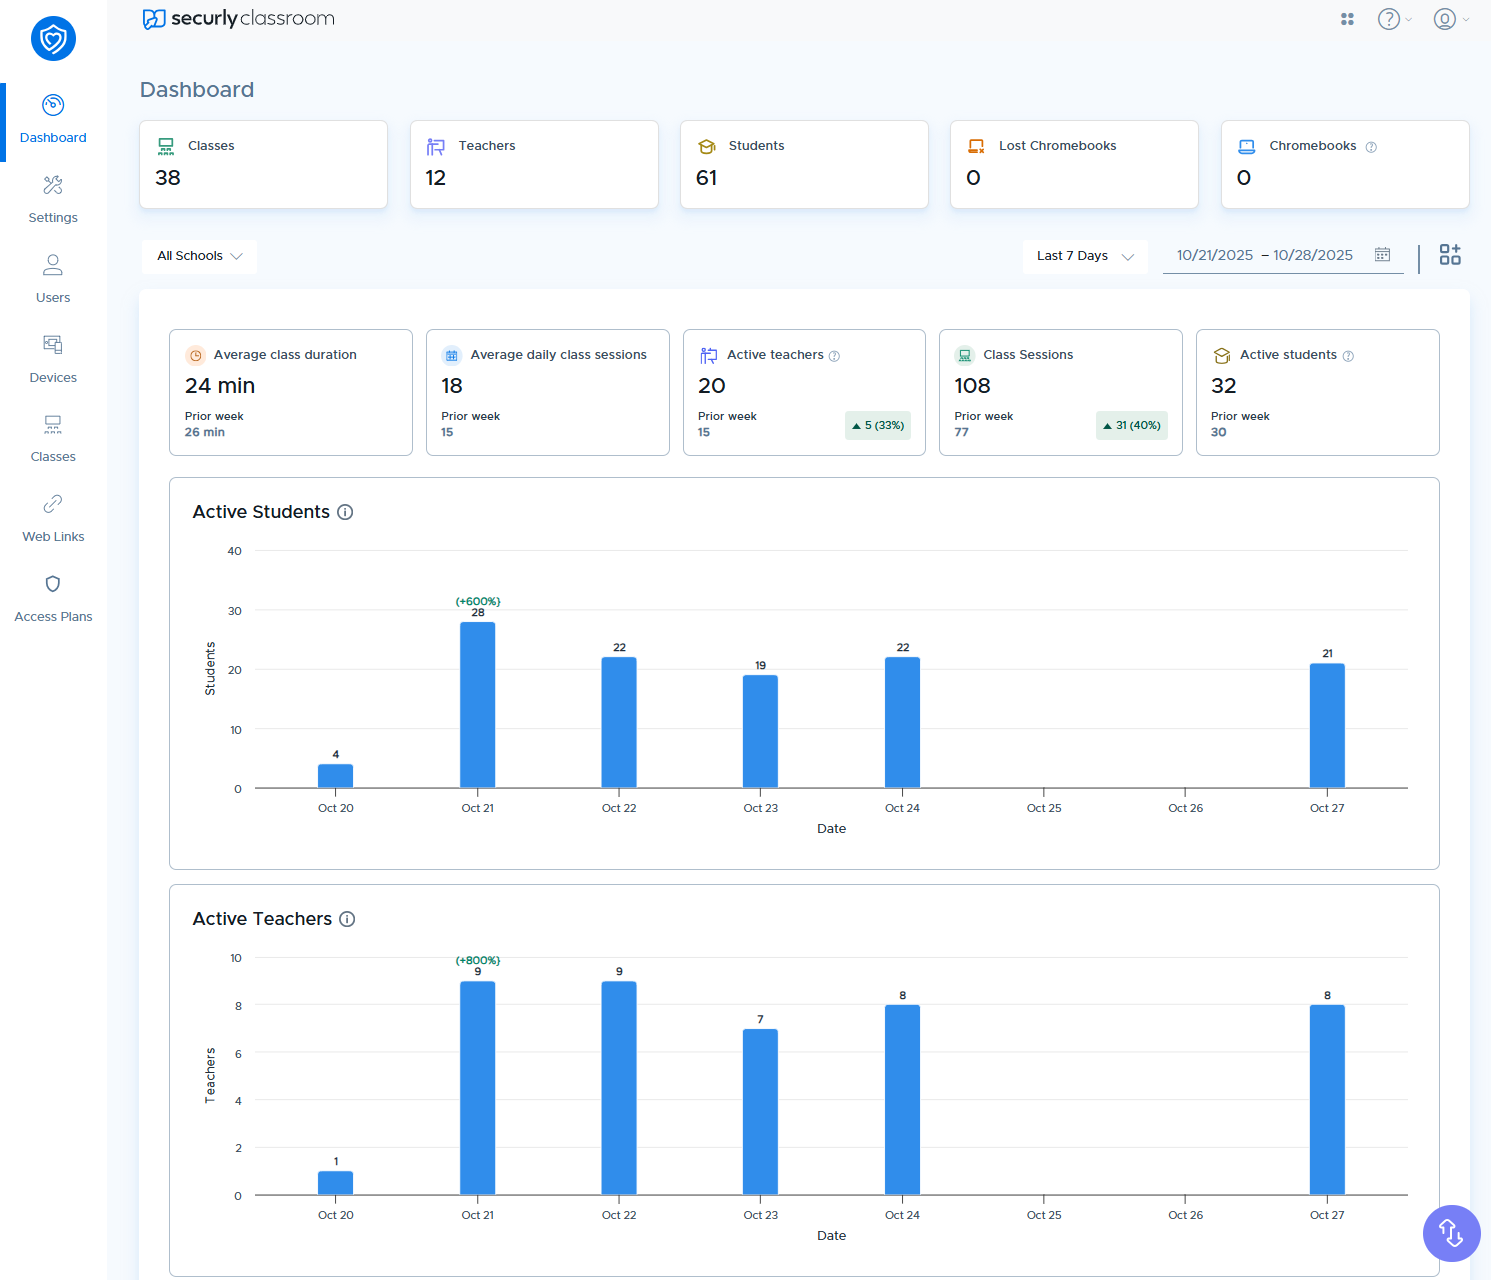
At the top of the dashboard, five cards display stats for the total number of classes, teachers, students, lost Chromebooks, and Chromebooks.
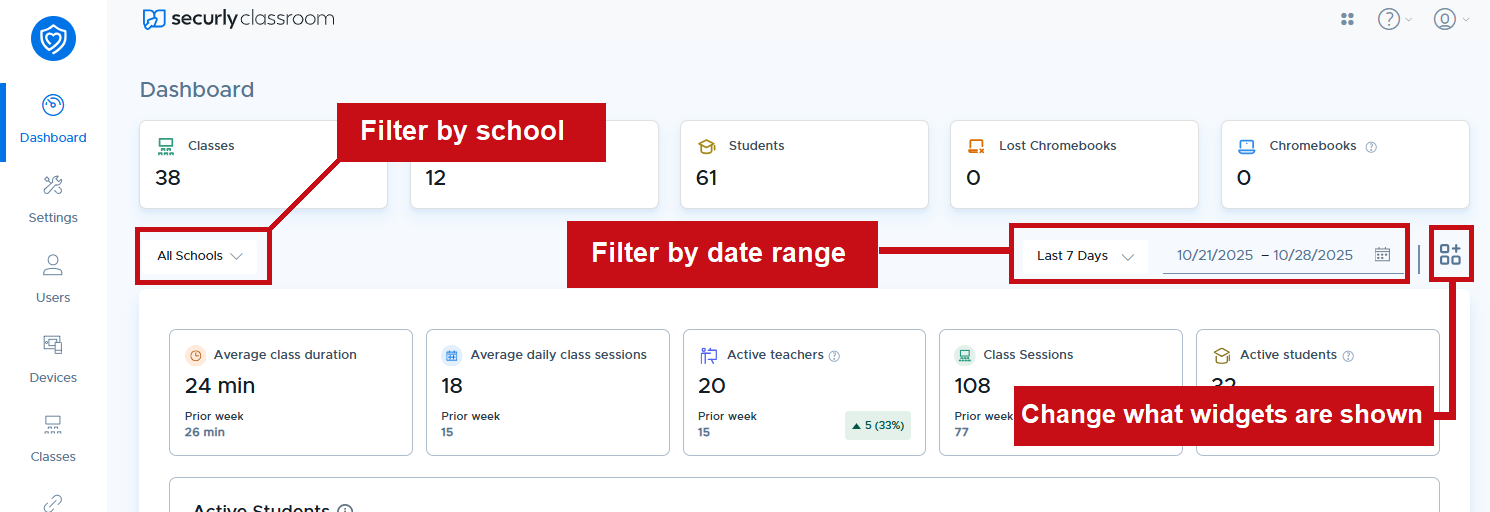
Below this, the main section of the dashboard displays data for the previous week by default. This data can be filtered by school and also by date range using the controls directly under the total cards. Click the gear icon to change which widgets appear.
Next, you'll see stat cards for average class duration, average daily class sessions, active teachers, class sessions, and active students based on your selected school or the entire district.
Further down the page, you'll find more widgets to analyze Classroom usage effectively.
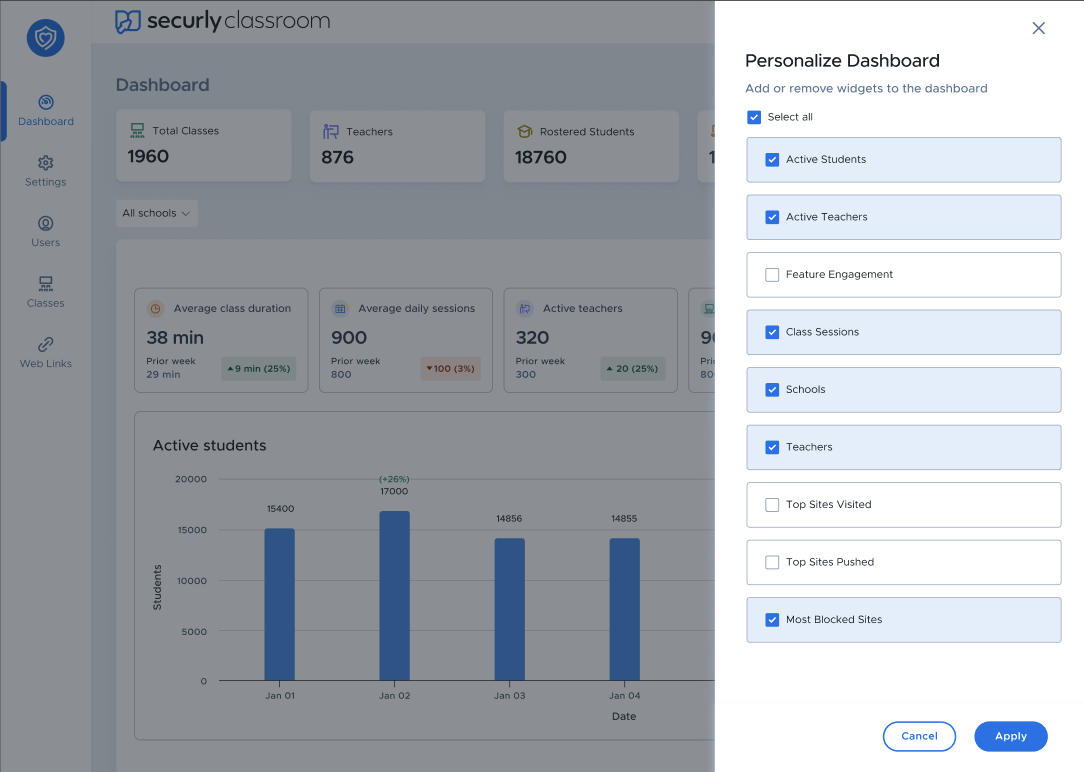
Personalize Dashboard
Clicking the gear icon allows you to change which widgets are shown on the Dashboard. From the Personalize Dashboard sidebar, you can show or hide any widget, then click Apply to save your changes.
How are statistics on the Admin Dashboard calculated?
- For the Active Students widget, an active student is one who participated in at least one class session during the selected time period.
- For the Active Teachers widget, a teacher is counted as active only when they manually start a class session.
- Under Top Sites Visited, a site visit is counted whenever a student opens the website. The duration is a count of the length of time that site was open as the active tab.