With this reporting feature, admin users are able to get a snapshot of Pass usage and trends in their school and/or across their district if they have membership in those schools.
- Admin with membership in one school will be able to see their school’s detailed Pass data. They can also view how their data compares to any other Pass schools in their district; however, the other school names will be hidden.
- Admin with membership to multiple schools will be able to see detailed and comparative data for all schools they belong to.
| IMPORTANT NOTE: If you need to add/roster district admin to your school, please click HERE for those details. |
| REMEMBER:
|


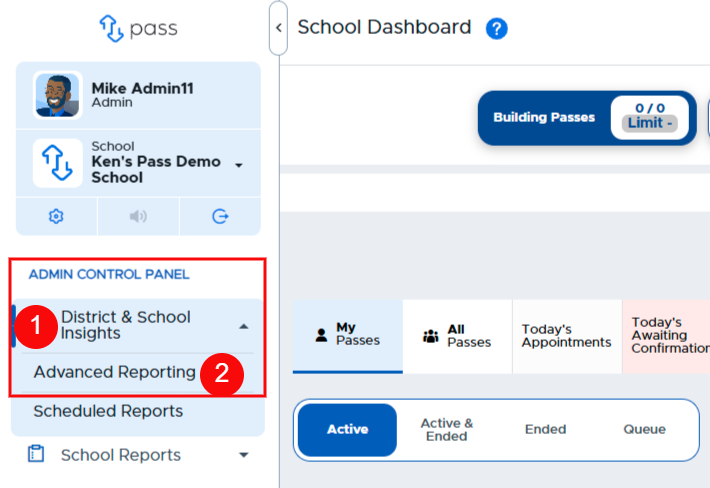
To access the District & School Insights tab, under the Control Panel, click Reports → District & School Insights.
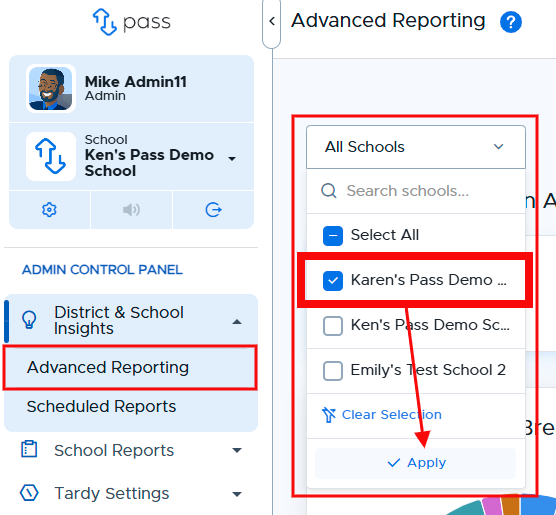
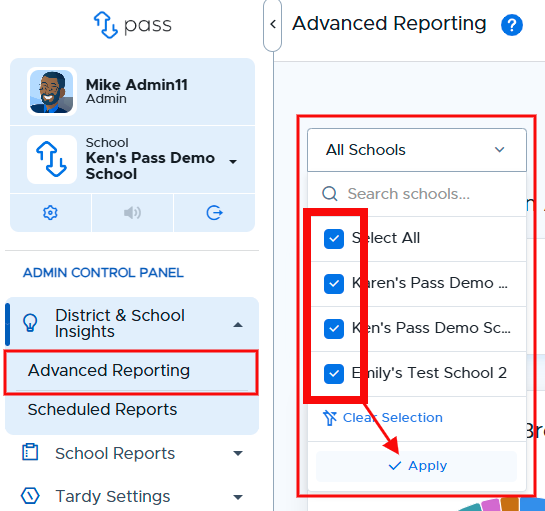
Using the School dropdown menu, admins can choose to view data from one school or multiple schools (as long as they have membership in those other schools). Click Apply once the school(s) is/are chosen.
| One School Chosen | Multiple Schools Chosen |
|---|---|
|
|
The first three graphs are static and provide an overview of Pass usage within a school/district:
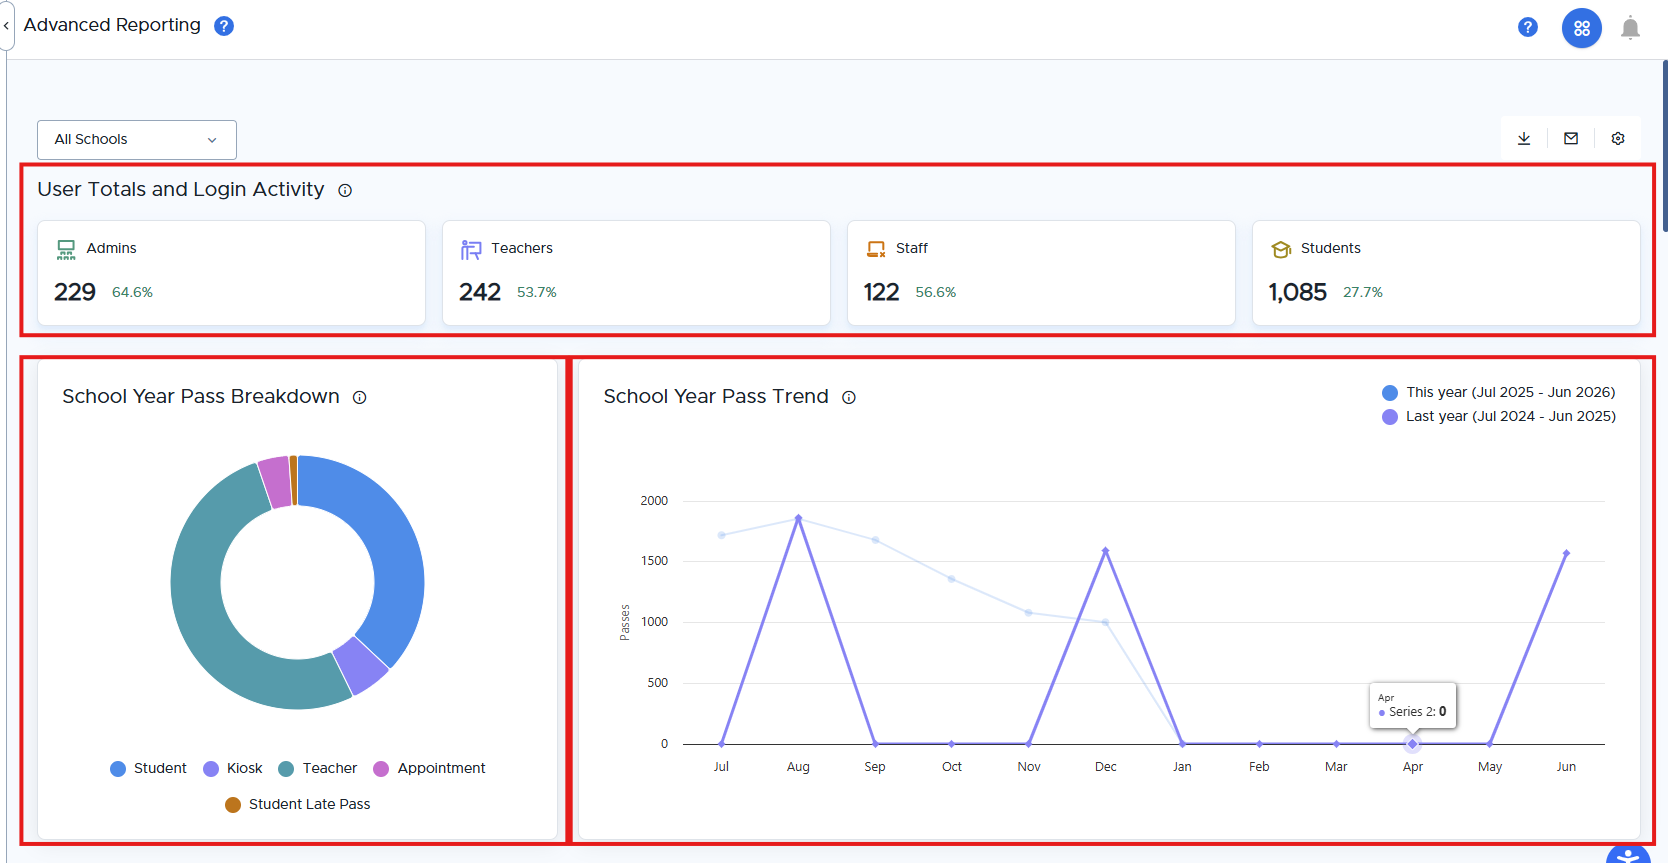
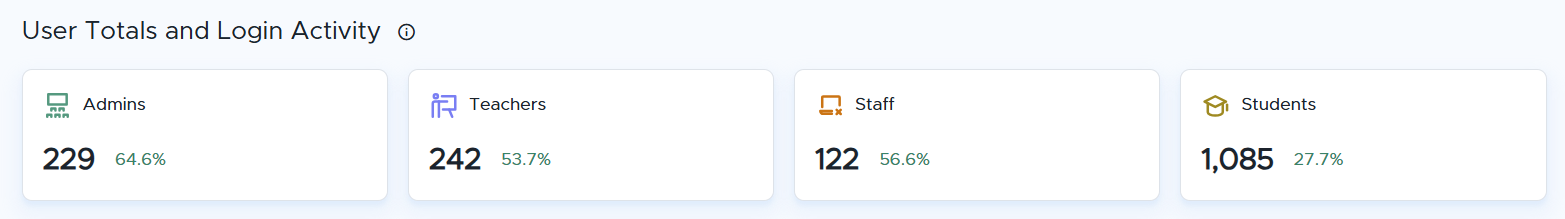
User Roles and % Logged In
Admin can see the total number of users shared by role (Admins, Teachers, Staff, Students) and percentage of those who have logged in.
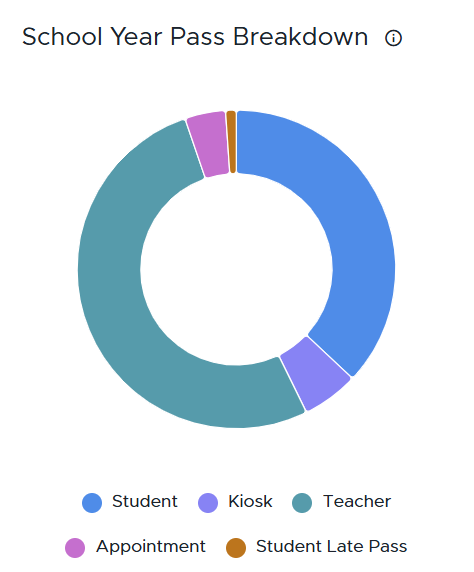
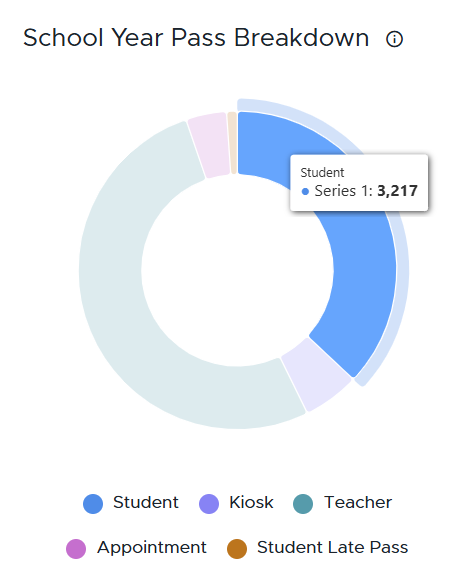
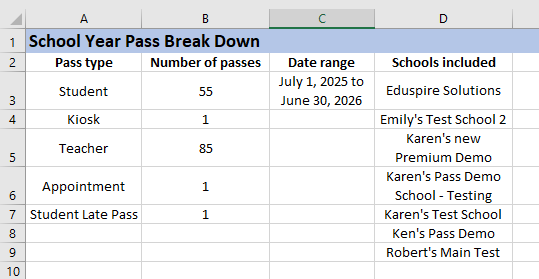
* COMING SOON - School Year Pass Breakdown
This chart shows how different pass types are being used throughout the year. An admin will see if all pass types are being used and how much each pass type is being used in relation to the other pass types. A school/district could have zero or very low usage of a particular pass type based on a school system's configuration or utilization. (Hover over the different sections to see the specific number of passes for that pass type.)
|
|
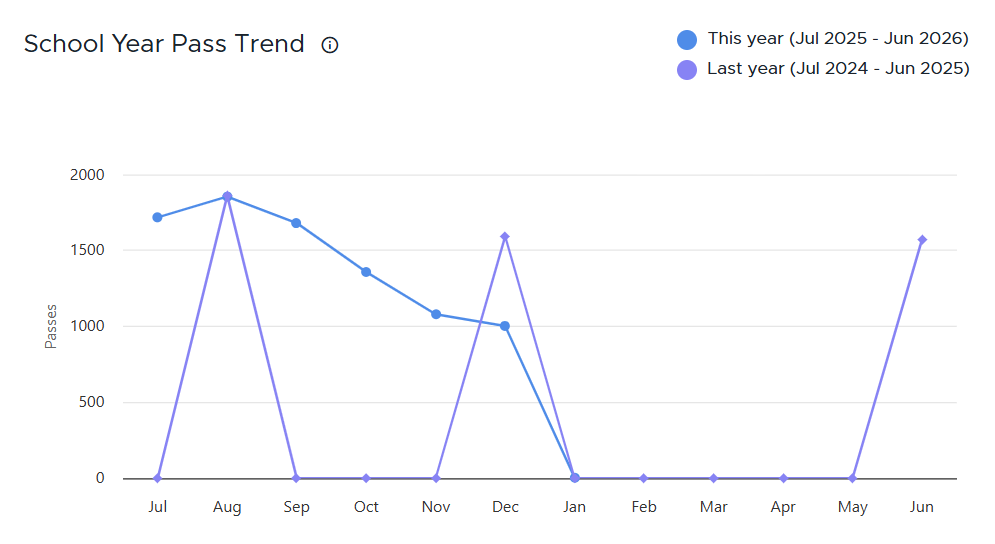
School Year Pass Trend Chart
The School Year Pass Trend Chart compares pass usage month by month, this year versus last year.
Specific School/District Pass Data
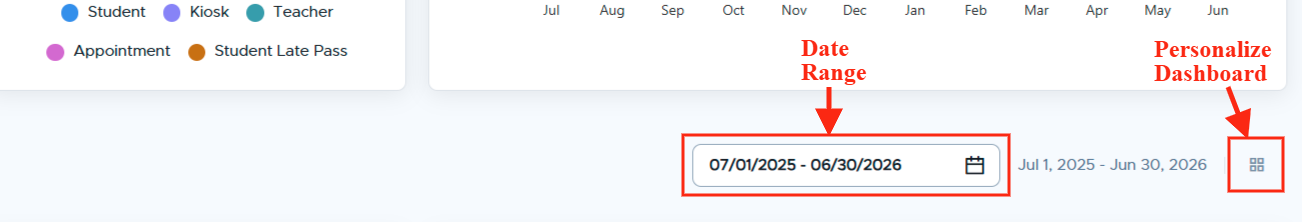
To dig even deeper into your school's/district's data, you can choose a specific date range. You can also select which Data Points to include on your District & School Insights page.
Under the School Year Pass Trend chart, click the date field and choose the desired date range. To the right, click the four (4) squares to personalize your data dashboard with the desired Data Points.
| |
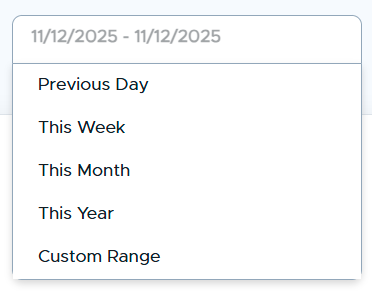
Date Range |
|
Data will be displayed as follows:
| |
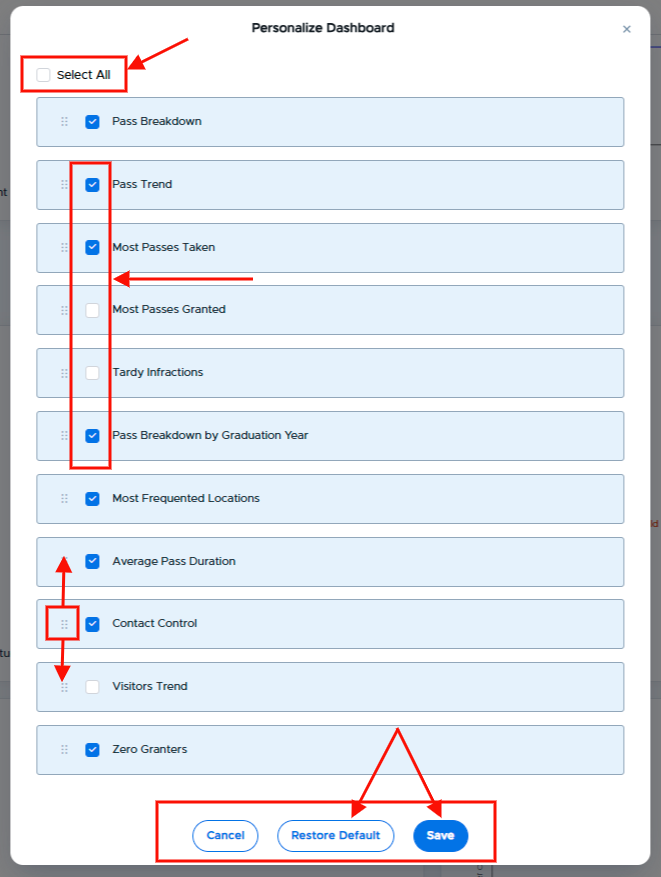
Personalize Dashboard |
|
Customize the Data Dashboard by selecting which charts to display and in which order.
| |
Pass Breakdown - Shows an admin if all pass types are being used and how much each pass type is being used in relation to the other pass types during the specified date range. A school/district could have zero or very low usage of a particular pass type based on a school system's configuration or utilization.
|
|


Pass Trend - Highlights daily pass activity for the selected time period.

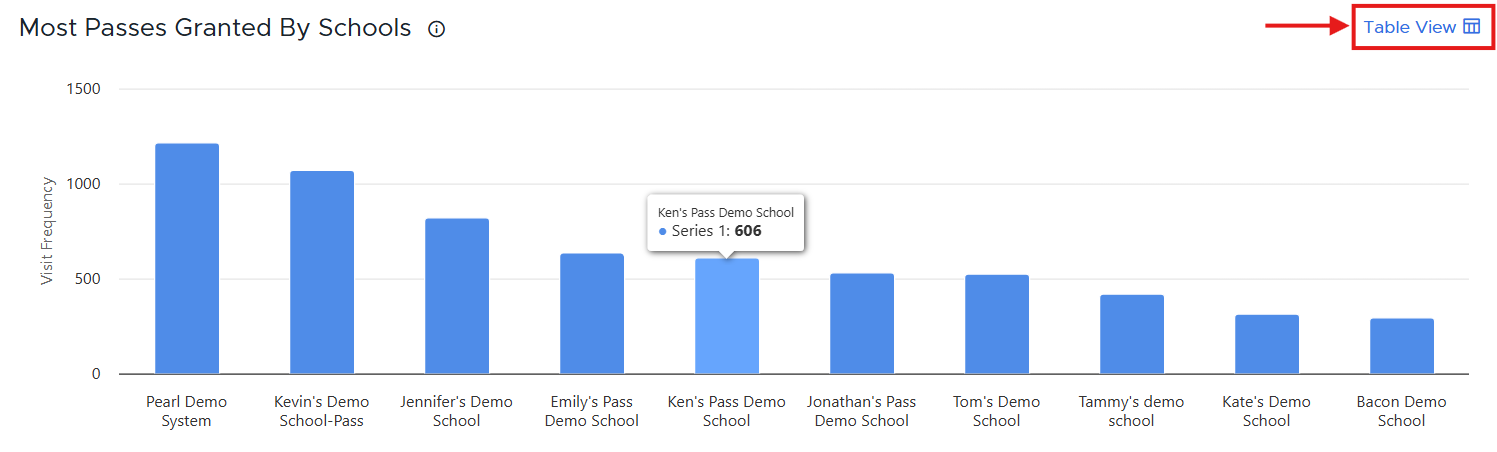
Most Passes Granted By Schools - Compare pass usage across all the schools in the district. This applies to the table view as well as downloaded and emailed reports.
Click Table View to see more detailed information. (The names of the school(s) selected will be displayed on the chart.)
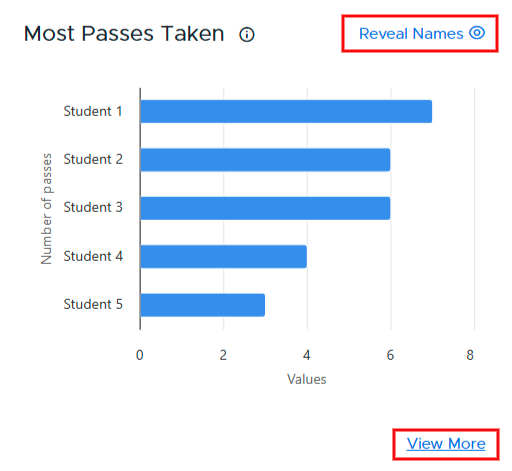
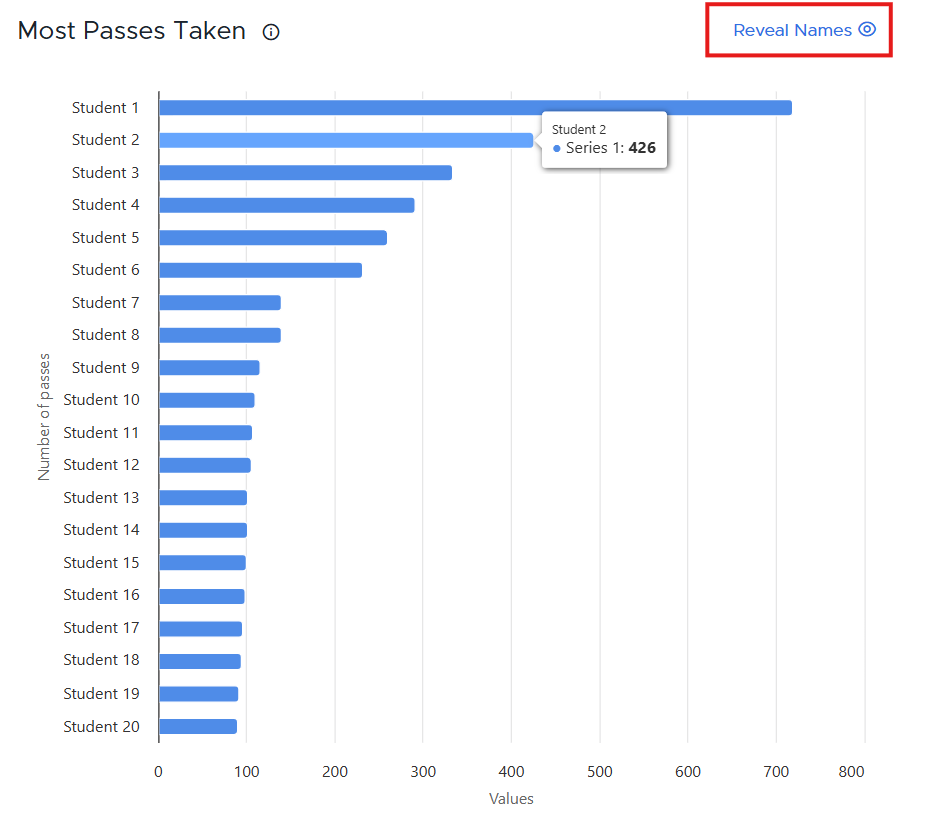
* COMING SOON - Most Passes Taken - Shows which students (top 5) are taking the most passes. To see the names of these students, click Reveal Names. Click View More to see a listing of the top 20 student pass takers.
| Top Five Students | View More |
|---|---|
|
|
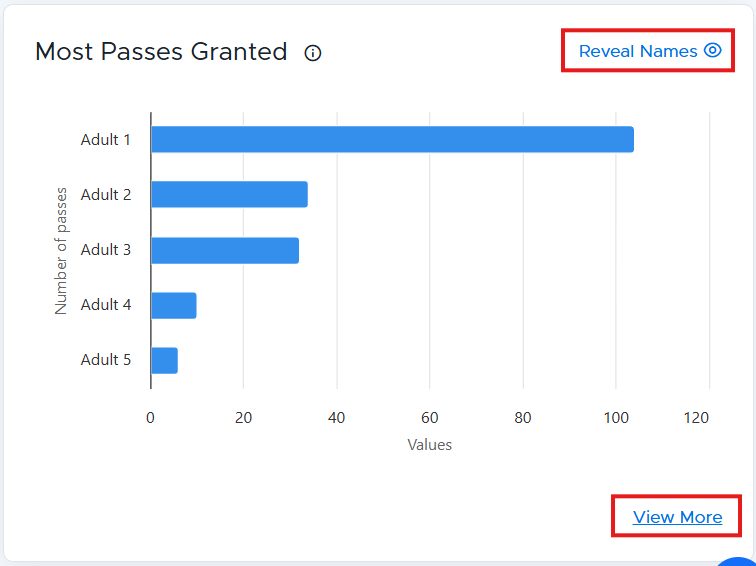
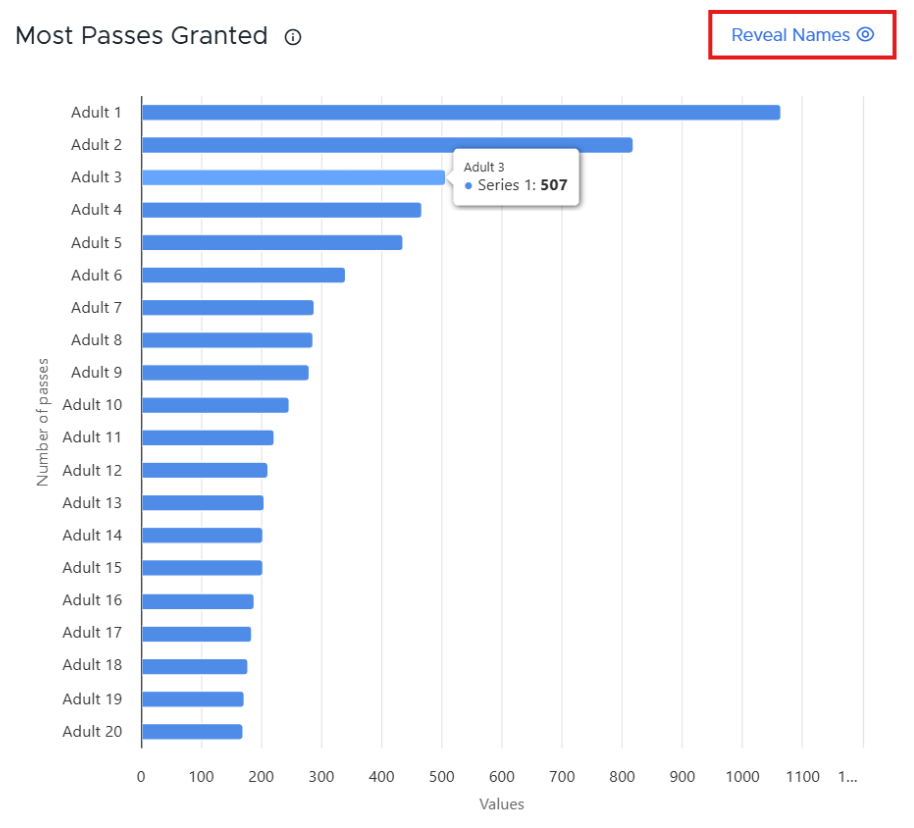
Most Passes Granted - Illustrates which adults (top 5) are granting the most passes. To see the names of these adults, click Reveal Names. Click View More to see a listing of the top 20 adult pass granters. (This data will include any adult who interacted with a pass, NOT just the adult who activated the pass.)
| Top Five Adult Pass Granters | View More |
|---|---|
|
|
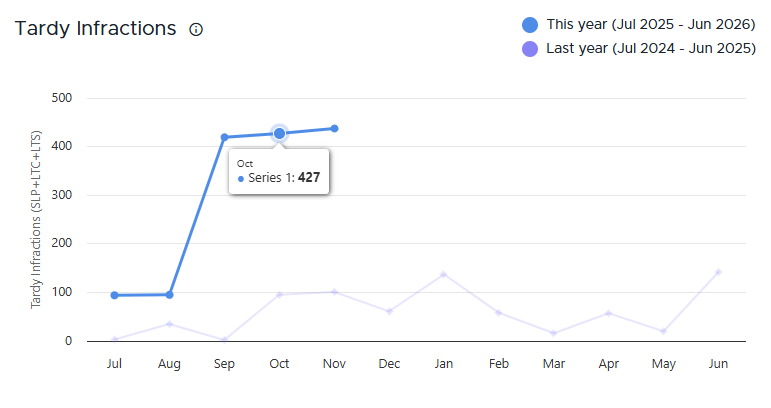
Tardy Infractions - Tracks tardies over time, including late passes.
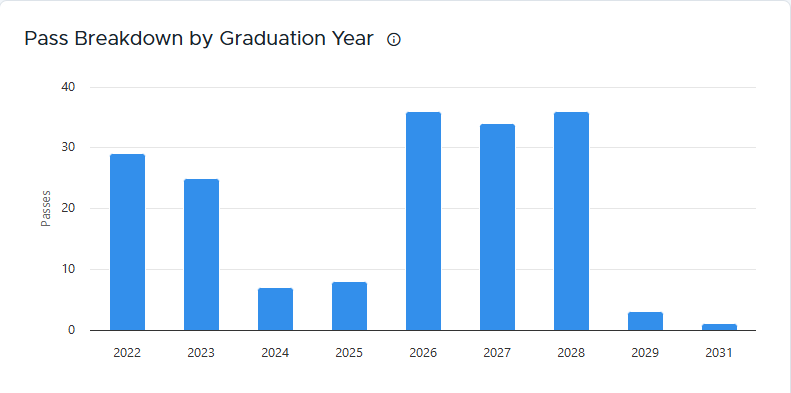
* COMING SOON - Pass Breakdown by Graduation Year - Shows pass usage by graduation year.
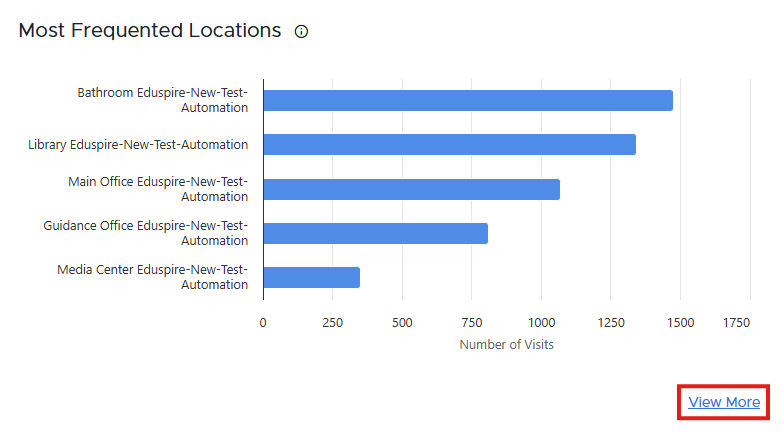
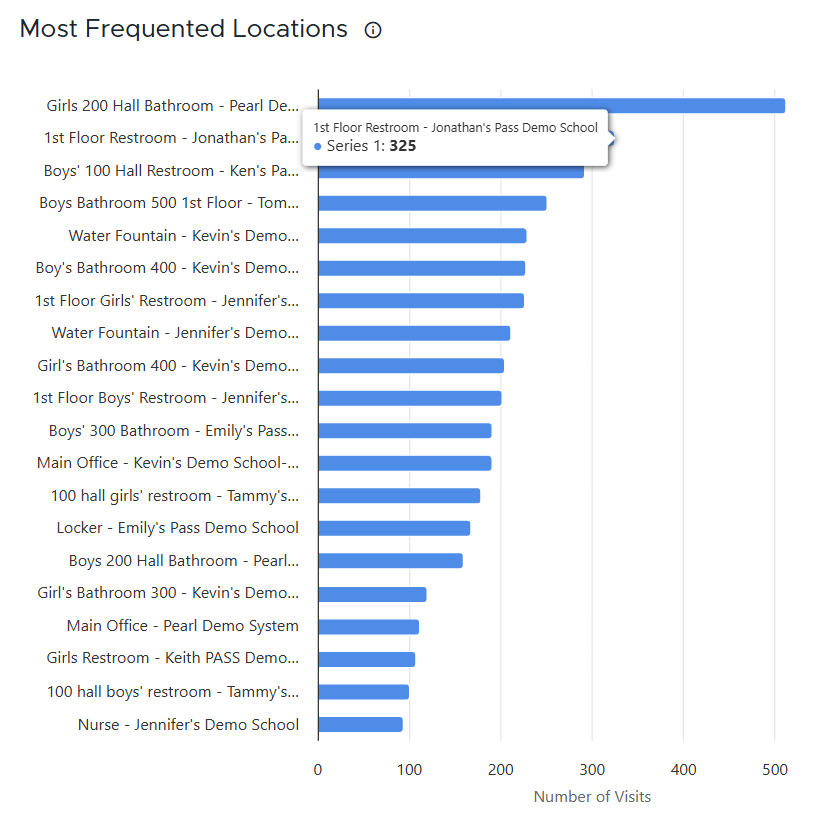
* COMING SOON - Most Frequented Locations - Displays which locations students visit most often.
| Top Five Locations | View More |
|---|---|
|
|
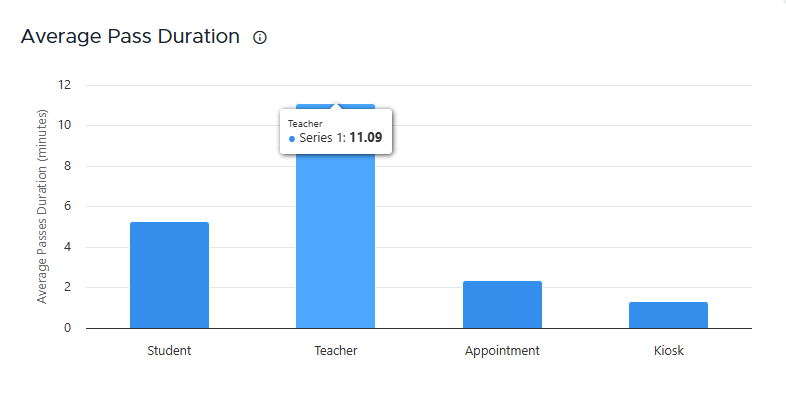
* COMING SOON - Average Pass Duration - Shows the average length of time for each type of pass.
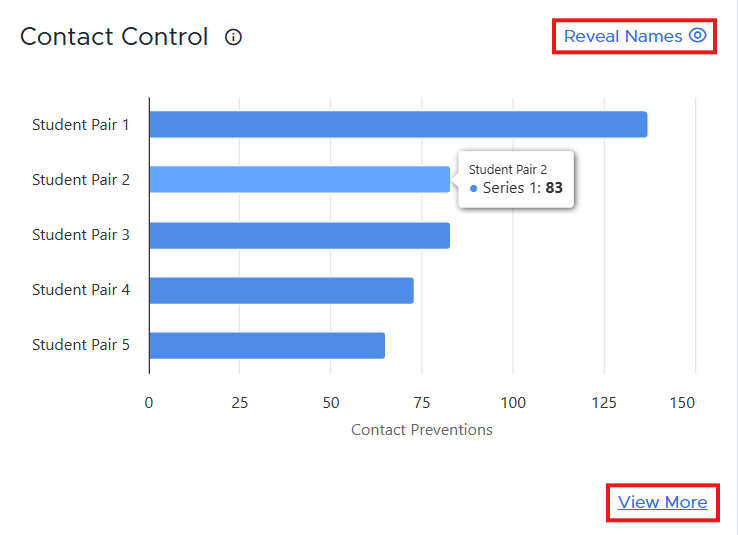
Contact Control - Illustrates prevented interactions between students who should be kept apart.
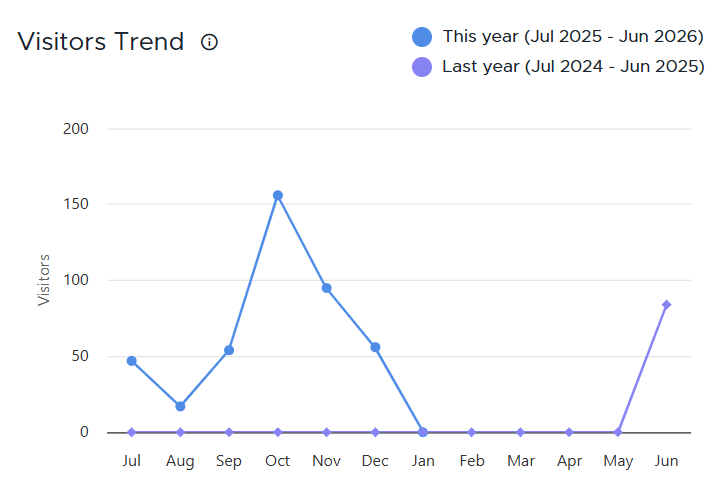
Visitors Trend - Tracks the number of visitors over time.
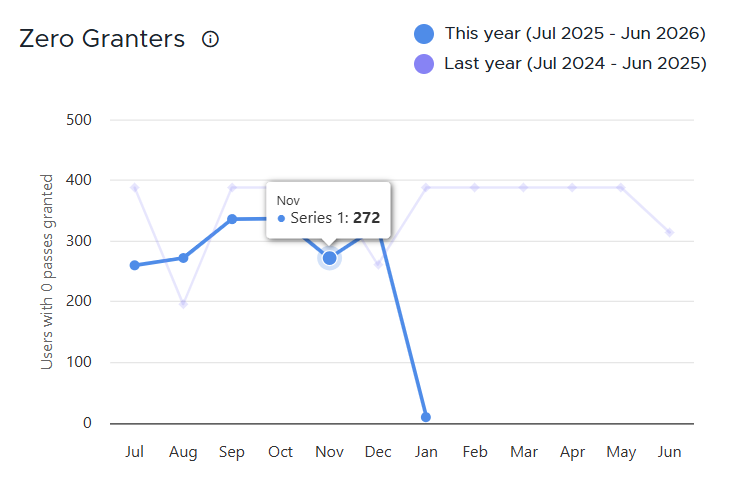
Zero Granters - Shows adults who haven't granted any passes.
| QUICK TIP: Based on what the data reveals, admins can make adjustments in their Pass system to school-wide limits, certain locations, or specific students. |

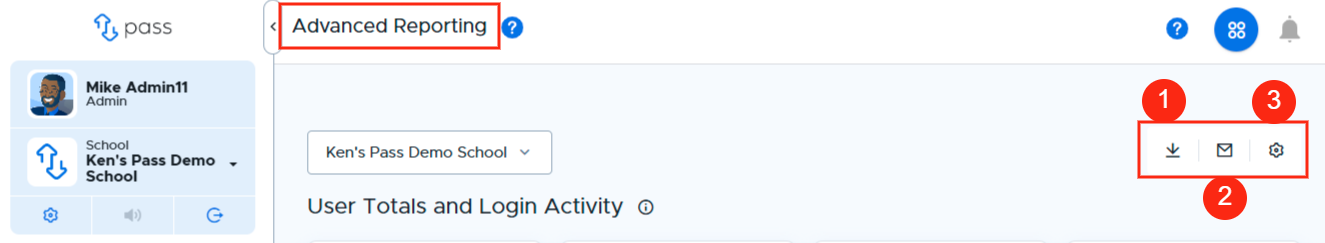
Export Options
Admin have three (3) different export options to share Pass data, and they live in the top right corner of the District & School Insights page.
- Download Report (#1)
- Email Report (#2)
- Schedule Report (#3)
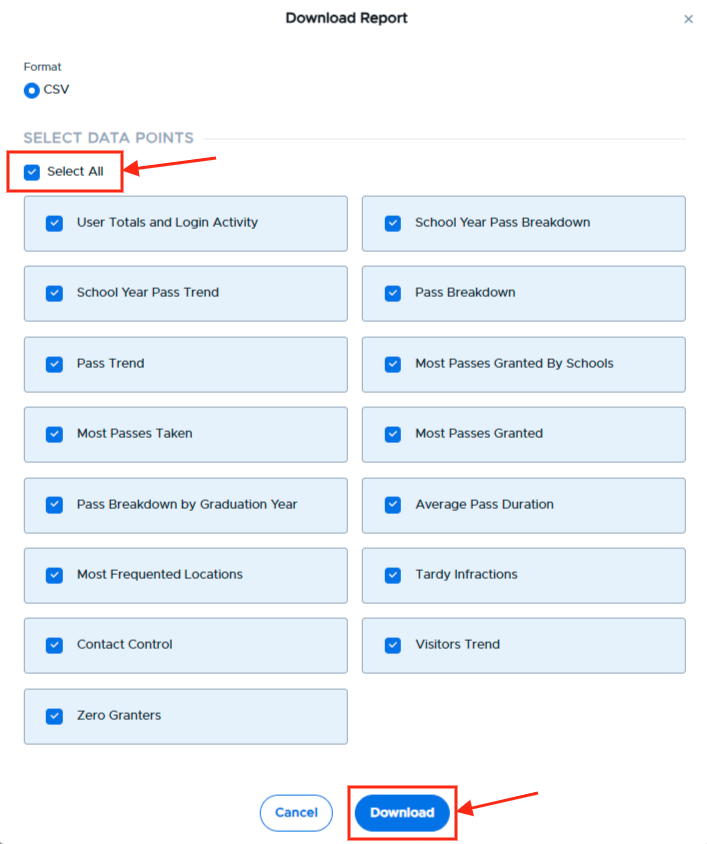
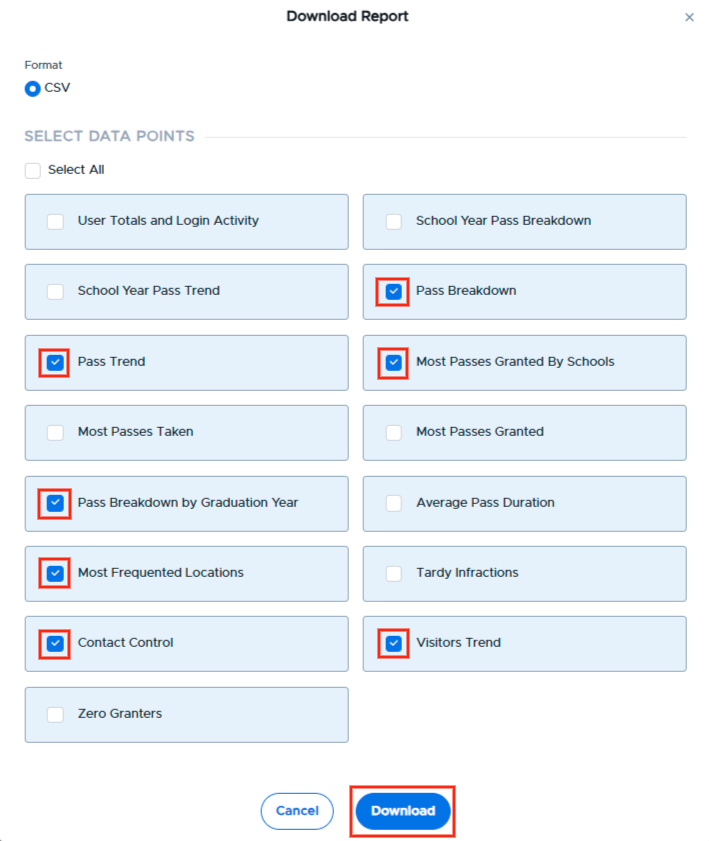
When the Download Report option is clicked, a Download Report popup will appear where an admin can check the boxes of the data points to be downloaded. When finished, click Download.
|
|
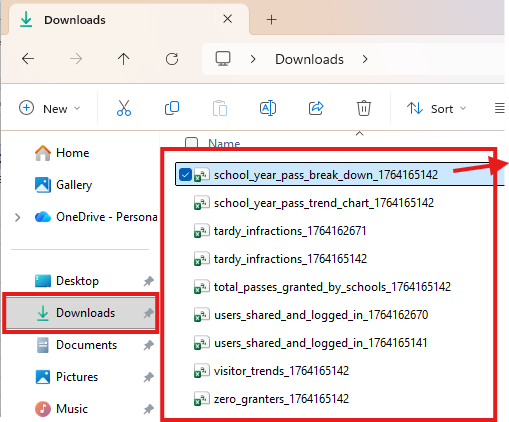
The files of the selected data points can be found in your Downloads folder on your computer.
|
|
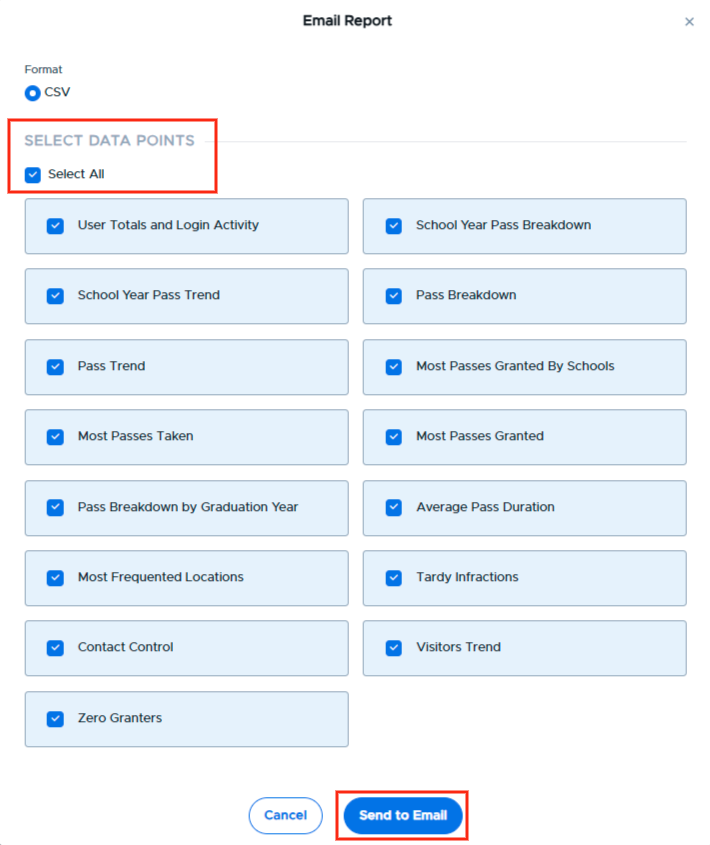
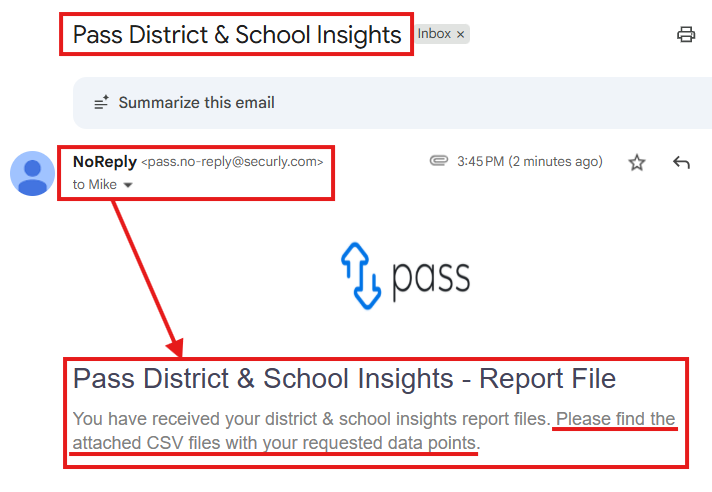
When the Email Report option is chosen, an admin can then select the data points and click Send to Email. Those selected files will then be emailed to that user’s email address, as listed in Pass.
|
|
|
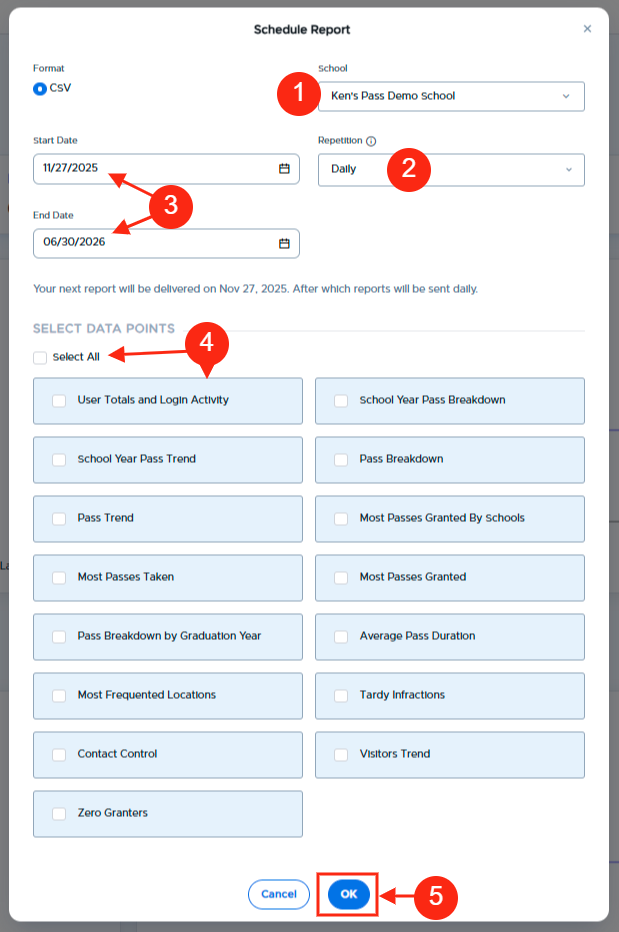
The Scheduled Report option allows an admin to schedule the selected data points to be emailed to them at the chosen frequency until the selected end date.
To schedule a report, click the gear icon. On the popup screen, an admin can select from the following options:
- Schools to include in the report
- Repetition of the report (Daily, Weekly, or Monthly)
- Start and End Dates
- Data Points to be included
Click OK when finished.